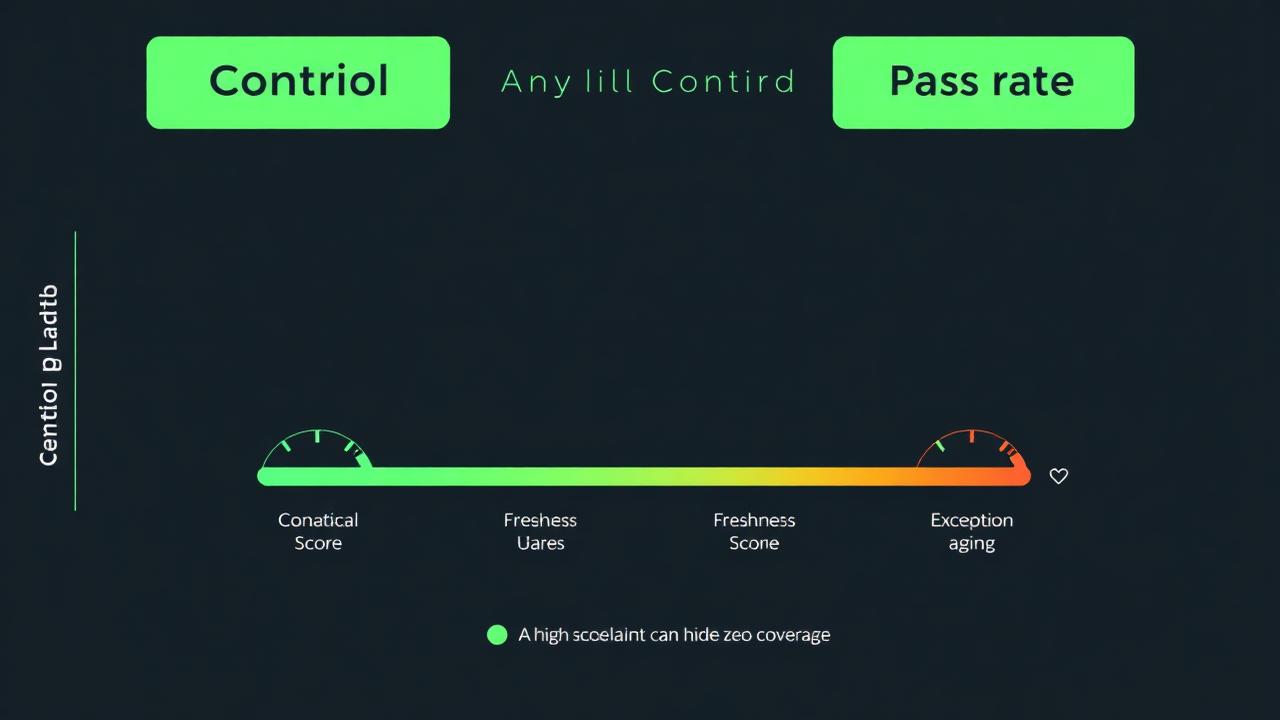
Coverage, freshness, pass rate and exception aging, and the denominators that turn a reassuring dashboard into a lie.
45 min 195 XPSkills: Metrics, Reporting, SQL
Brief
Once controls emit data, someone will ask for a dashboard. The temptation is to publish a single percentage. The useful version publishes four numbers per control: coverage, freshness, pass rate and exception aging, because each one fails in a different, silent way.
Coverage says how much of the population the check saw. Freshness says when it last ran. Pass rate says what it found. Exception aging says how long you have tolerated what it found.
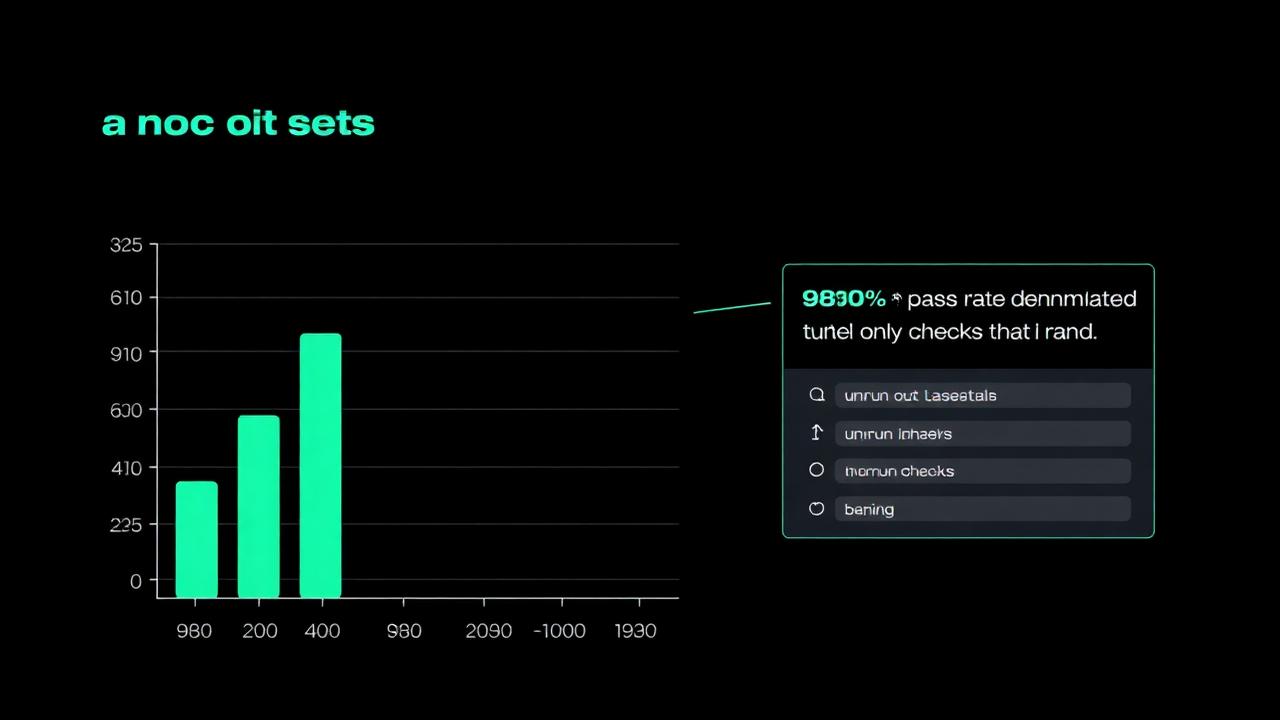
A control at 100% pass rate over 4% of the estate is not a healthy control. It is an unsampled one.
The scorecard that survives a challenge
Every metric on a control scorecard needs three things attached: the numerator, the denominator and the window. 'MFA compliance: 98%' is unauditable. '3,332 of 3,400 active admin accounts enrolled, evaluated daily, window 1-31 August' is a measurement someone else can reproduce.
Publish the window with the number and disagreements become arithmetic rather than opinion.
Four numbers per control. Reading only one of them is how programs get surprised.
The denominator is where the lying happens
Almost every flattering compliance metric is flattering because of its denominator. Measure enrolled users over users who logged in this month and departed accounts vanish. Measure patched hosts over hosts the scanner could reach and the unreachable ones, the interesting ones, disappear.
The rule: the denominator is the population the control claims to cover, taken from an authoritative source, not from the tool doing the measuring.
Same numerator, two denominators, two very different conversations.
Aging beats counting
An exception count is a vanity metric: it goes down when someone closes tickets, not when risk falls. Aging, how long each open exception has been open, bucketed against its approved expiry, tells you whether the program is absorbing risk or clearing it.
Trend matters more than level. Twelve exceptions with a median age of six days is a functioning program. Four exceptions with a median age of eleven months is a queue nobody owns.
Report the oldest exception by name. Averages hide the one that will hurt you.
Tasks
Answers are graded on the server: the answer key never reaches your browser.
Task 1: Ninety-nine percent of what?
Scenario sim+65 XP
Name the part of the metric that is wrong, then the source it must come from.
Incident brief
The patching scorecard reports 99% compliance and has done for two quarters. The number is computed as patched hosts divided by hosts the scanner reported on.
An incident starts on a host that has not been scanned since March because its agent stopped reporting. It does not appear in either side of the fraction.
The security lead's response is that the metric is accurate: every host it measured really was patched.
1.1Name the part of the metric that is wrong. (one word)
1.2Name the source it must come from. (two words)
Task 2: Green, and eleven weeks old
Scenario sim+65 XP
Name the missing metric, then what the tile is actually showing.
Incident brief
The access-review tile on the executive dashboard is green and reads 100%. The underlying job last completed on 14 June; a credential rotation in late June broke it and the dashboard renders the last successful result.
It is now September. Nobody has looked at the job logs because the tile is green.
The dashboard has no field showing when a result was produced.
2.2Name what the tile is actually showing. (two words)
Task 3: Four exceptions and a clean quarter
Scenario sim+65 XP
Name the metric that would expose this, then what the count is measuring instead.
Incident brief
The exception register shows four open items, down from nineteen. The quarterly pack leads with the reduction as evidence the program is maturing.
Three of the four have been open since the year before last, two are past their approved expiry, and eleven of the fifteen closures were bulk-closed by an administrator during a tool migration with the note 'migrated'.
The patching tile reads 99% and has for two quarters. It is computed as patched hosts over hosts the scanner reported on, with no window and no age, and the security lead insists it is accurate because "every host it measured really was patched".
Rewrite the definition so a stranger could recompute it: an authoritative denominator, an explicit window, a freshness threshold, and exception health expressed as aging rather than a count.
Current tile, and what the sources can provide
current: patched_hosts / hosts_scanner_reported_on   -> 99%

available sources:
  asset_inventory   : authoritative list of hosts that exist (4,180)
  scanner_output    : hosts the scanner could reach this month (2,910)
  exception_register: open exceptions with opened_at and approved_expiry

notes:
  a host whose agent stops reporting disappears from scanner_output
  the tile currently renders the last successful result with no timestamp
The quarterly control scorecard goes to the audit committee on Friday. Six metric definitions are up for review, and the team's position is that every one of them is 'already reported today'.
Accept the definitions someone outside the team could reproduce. Reject the ones that cannot survive a question about what they divide by, when they were true, or what they actually track.
Verdicts are accept or reject. Every rejection needs one reason code from: tool-denominator | no-window | count-not-aging | no-freshness.
scorecard_definitions.yaml: entries under review
H-1  MFA enrolment: 3,332 of 3,400 active admin accounts taken from the HR-backed identity inventory, evaluated daily, window 1-31 August.
H-2  Patch compliance: patched hosts divided by hosts the vulnerability scanner reported on this month.
H-3  Exception aging: open exceptions bucketed 0-30 / 31-90 / 90+ days against approved expiry, oldest item named.
H-4  Access review compliance: 98%. No period, no counts, no run date.
H-5  Exception health: count of open exceptions, quarter over quarter, presented as the risk trend.
H-6  Backup verification tile: renders the last successful check result; the tile carries no timestamp and no staleness threshold.
1
2
3
4
5
6
7
8
9
10
11
12
13
14
15
16
17
18
19
Checks
Every line in the fixture carries a verdict
Accept and reject land on the right lines
Each rejection cites a valid reason code
Next on your path · Data & Evidence
Drift Detection & Alert Design
Declared state versus observed state, detection latency, suppression windows, and alerts a human can actually act on at 3am.