Answer auditor questions with queries: coverage, exceptions, aging and control health metrics.
45 min 190 XPSkills: SQL, Metrics
Auditor questions are queries
"How many production servers are missing the agent?" "Which access reviews are overdue?" "Show me every exception open more than 90 days." Each of these is one query against a compliance data model, and answering them by hand is why compliance teams are permanently busy.
The shift is from producing reports to publishing queries. A query can be re-run in front of the auditor, which is a materially stronger artifact than a spreadsheet you assembled last Tuesday.
The denominator is the control
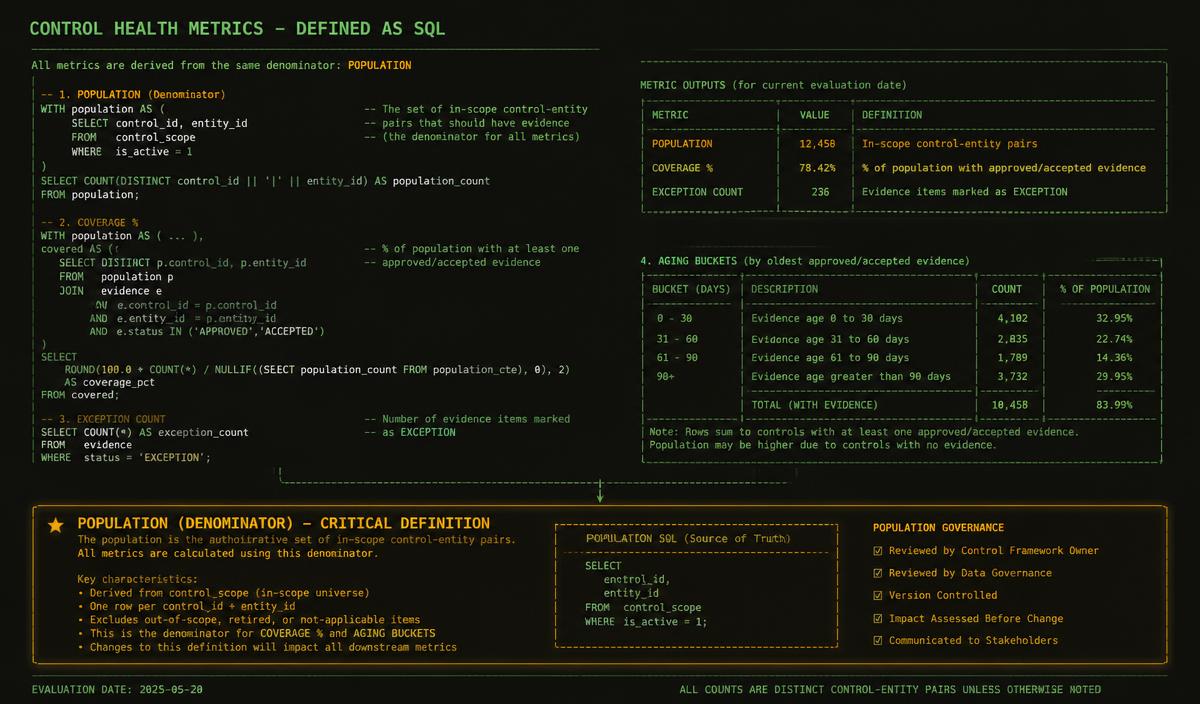
Coverage is a fraction, and nearly every misleading compliance metric is a bad denominator. Ninety-eight percent of what? Of hosts the agent reported on, which by construction excludes every host that failed to report.
Define the population from an authoritative source independent of the thing being measured: the asset inventory, the HR roster, the cloud account list. Then coverage is measured against reality rather than against the subset that happened to answer.
A coverage metric whose denominator comes from the tool being measured will always look excellent.
Every honest metric on this page depends on the panel at the bottom.
The join that quietly loses people
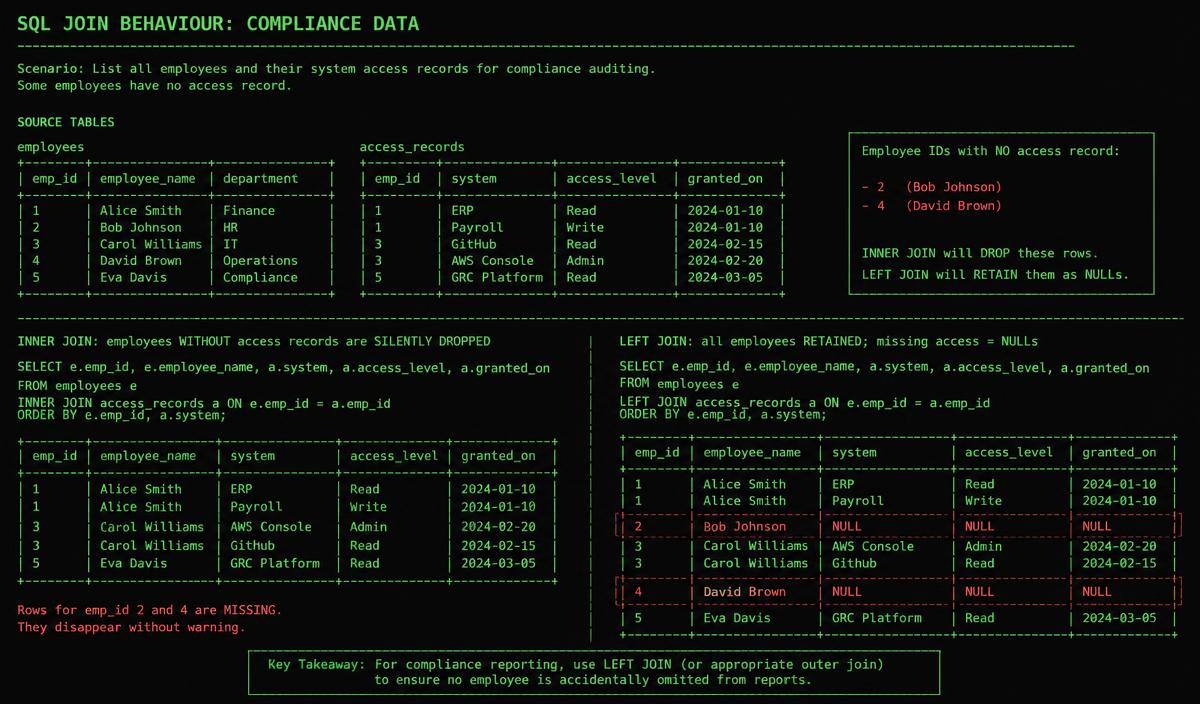
An inner join between employees and access records returns only employees who have access records. Run an access review off that query and every employee whose account was provisioned outside the standard flow, which is exactly the population you were looking for, is absent from the output.
The result looks complete. It is sorted, it has plausible row counts, and nothing warns you. Left join from the authoritative population and treat the NULLs as findings, because a missing row is usually the finding.
The rows an inner join removes are the ones you were hired to find.
Aging, not counts
"236 open exceptions" tells you nothing about whether the program is healthy. Bucket them by age, 0-30, 31-60, 61-90, 90-plus, and the shape tells the story: a fat 90-plus bucket means items enter the register and never leave.
The same applies to remediation. Median time to close, trended by month, is the metric that reveals whether the program is improving; a total count mostly reveals how busy the intake was.
Make the query the artifact
Version the SQL alongside the control it measures, so a number in a board deck can be traced to the exact query, on the exact date, against the exact population definition. When the number moves, the diff shows whether reality changed or the definition did.
It also ends a specific and common argument: two teams reporting different coverage percentages for the same control, each convinced the other is wrong, when the actual disagreement is about the denominator neither wrote down.
Tasks
Answers are graded on the server: the answer key never reaches your browser.
Task 1: Ninety-eight percent of the ones that answered
Scenario sim+65 XP
Name the part of the metric that is wrong, then where it should have come from.
Incident brief
Endpoint coverage is reported at 98.4% and has been for three quarters. The query counts hosts in the agent's own console where status is healthy, divided by all hosts in that console.
The asset inventory lists 1,240 production hosts. The agent console lists 812. The 428 hosts that never installed the agent cannot appear in either half of the fraction.
True coverage is 64%. Nobody has misreported anything: the query does exactly what it says.
1.1Name the part of the fraction that is wrong. (one word)
1.2Name the authoritative source it should come from. (two words)
Task 2: The eleven who were never reviewed
Scenario sim+65 XP
Name the join that dropped them, then the join that would have kept them.
Incident brief
The quarterly access review query selects employees joined to access_records on employee id, and produces 604 rows that reviewers work through diligently.
A leaver investigation later finds eleven accounts provisioned by a legacy script that never wrote an employee id into access_records. None of the eleven appeared in any review for two years. Two belonged to people who had left.
The output was never short. It was sorted, plausible, and 604 rows long every quarter.
Term bank, not all of these are right
inner joinleft joinouter joincross joinnullorphan record
2.1Name the join that removed the eleven accounts. (two words)
2.2Name the join that would have retained them. (two words)
Task 3: Two hundred and thirty-six
Scenario sim+60 XP
Name the analysis the count is hiding, then the trend metric that shows whether the program is improving.
Incident brief
The exception register has held roughly 236 open items for four consecutive quarters, and the steady number is presented as evidence of a stable program.
Breaking it apart: 4,102 items closed within 30 days over the year, while 3,732 items have been open for more than 90 days, including 61 opened before the register was migrated in 2023.
Intake and closure happen to balance. The oldest third of the register never moves.
Term bank, not all of these are right
agingtime to closebacklogthroughputcoveragepopulation
3.1Name the analysis the flat count is hiding. (one word)
3.2Name the trend metric that shows real improvement. (three words)
Labs
80 bonus XP
Hands-on work. You edit the artefact, the server runs the checks: the expectations and the reference solution never reach your browser.
Your CISO wants "a list of admins without MFA" for tomorrow's risk committee. The identity team says the number is zero, because their dashboard counts anyone with any factor enrolled.
SMS is a factor, but it is not a factor the policy accepts for administrative access, and deactivated accounts should not inflate the finding. Write a query over the `users` table returning the email of every ACTIVE admin whose MFA factor is not one of the accepted strong factors.
Table: users
email                | role   | status   | mfa_factor
---------------------+--------+----------+-----------
ada@corp.example     | admin  | active   | webauthn
brs@corp.example     | admin  | active   | sms
cyn@corp.example     | admin  | active   | none
dev@corp.example     | admin  | disabled | none
eli@corp.example     | member | active   | none
fai@corp.example     | admin  | active   | totp
gus@corp.example     | admin  | active   | sms

Policy: strong factors for admin access are
webauthn and totp. Anything else is a gap.
You inherit eight compliance queries that feed the evidence pack. Each is described with its result and how it was written.
Raise the queries whose output would mislead a reviewer. Leave the ones that are merely inelegant.
List only the lines that qualify, worst first. Severity is one of: critical | high | medium | low. Add or delete rows as needed.
Query catalogue
Q-1  Admin MFA gap: INNER JOIN to mfa_enrolments, so admins with no enrolment row vanish and the result reads zero gaps.
Q-2  Leaver access: filters WHERE terminated_at > '2025-01-01' but the column is nullable; nulls silently dropped.
Q-3  Change approvals: correct join, returns 8,142 rows, matches the source count.
Q-4  Vulnerability SLA: uses SELECT * rather than named columns.
Q-5  Access review: compares status = 'Approved' against data that stores 'approved' lowercase; returns zero.
Q-6  Backup restores: query is 90 lines with no comments.
Q-7  Encryption config: correct, but run against the read replica lagging 40 hours behind production.
Q-8  Vendor list: results ordered non-deterministically without ORDER BY.
1
2
3
4
5
6
7
8
9
10
11
12
Checks
The right findings are raised
Benign lines are left out
Severity matches the actual exposure
Ranked worst first
Next on your path · Data & Evidence
Evidence Integrity & Chain of Custody
Hashing, canonical payloads, immutable storage and the run metadata that lets an auditor re-derive an artefact you collected nine months ago.