Move from point-in-time testing to always-on monitoring with alerting and drift detection.
60 min 260 XPSkills: CCM, Monitoring
From samples to populations
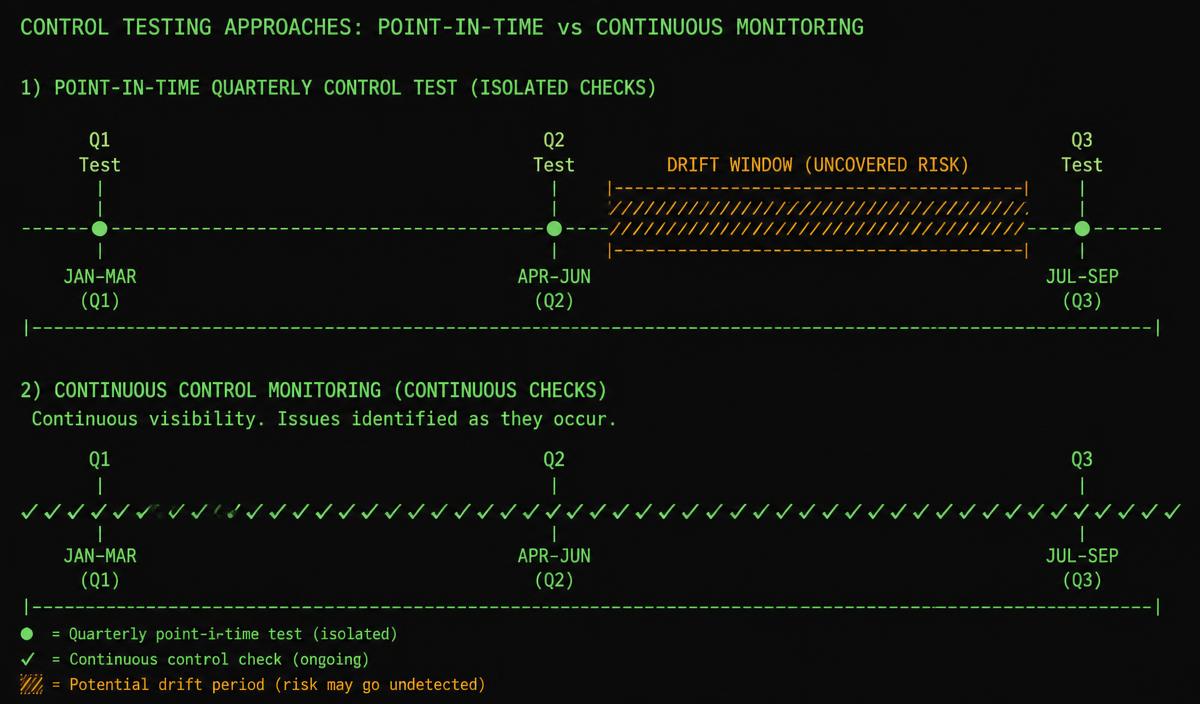
Point-in-time testing asks whether a control worked on the days you looked. Continuous control monitoring asks whether it worked every day, across the whole population, and tells you the same week it stopped.
The change is not primarily technical. It is that exceptions arrive continuously, in small numbers, addressable, instead of arriving all at once during an audit, months after anything could be fixed.
The drift window is where every unpleasant audit finding lives.
Every monitor needs three definitions
The population: what should be in scope, defined by a query rather than a list somebody maintains. The test: the condition that constitutes compliance for one member of that population. The threshold: what proportion of failures is acceptable before this becomes an exception rather than noise.
Skip the population definition and you get the most common CCM lie: a monitor that reports 100% compliance because the only things it examines are the things already known to be compliant.
The monitor that has nothing to say
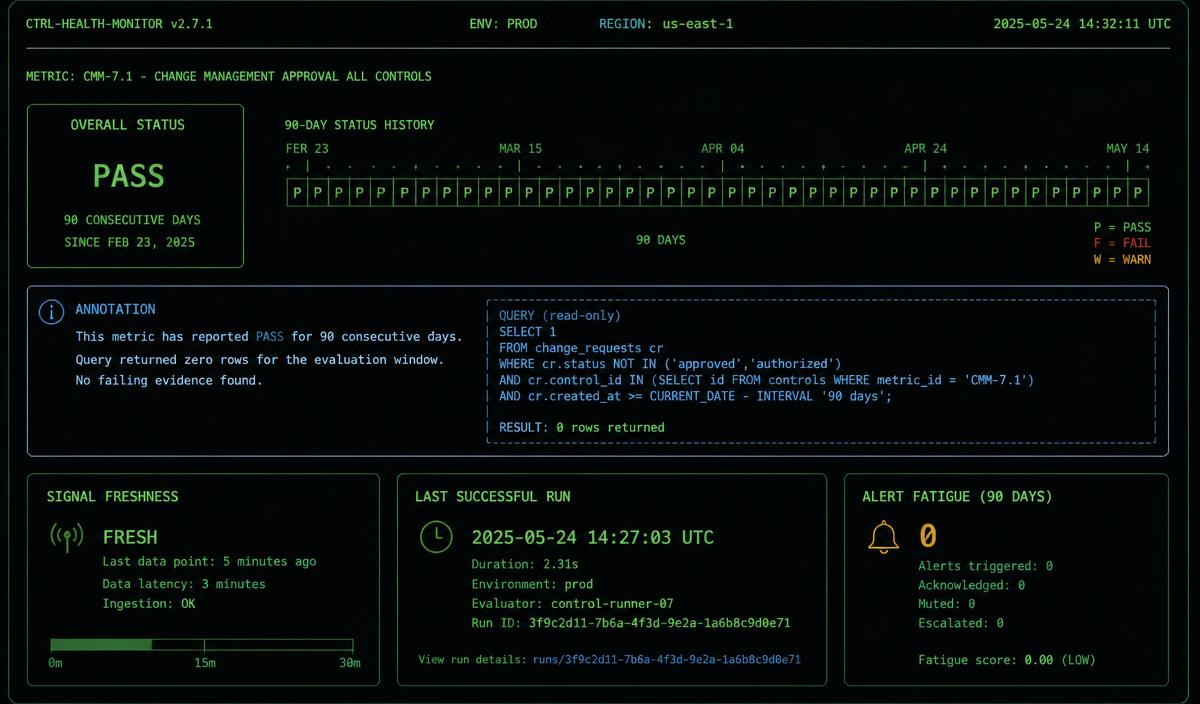
A control monitor that returns zero failing rows reports PASS. A control monitor whose upstream table stopped loading also returns zero failing rows, and also reports PASS. Ninety consecutive green days is at least as likely to mean the signal died as it is to mean the control is perfect.
So monitor the monitor. Assert that the population count is within an expected range, that the source data is fresher than the check interval, and alert on a metric that has not changed in a suspiciously long time. Absence of evidence is not evidence of compliance.
Alert on stale signals with the same seriousness as failing ones. A dead monitor is a control with no coverage at all.
Ninety days green, zero rows evaluated. Both facts were on the same screen.
Drift is the thing you are actually hunting
Most control failures are not events, they are decay: a bucket policy loosened for a migration and never restored, a group that quietly accumulates members, an exception that was never closed. Nobody breaks the control; it erodes.
Detecting decay means comparing current state against an intended baseline and alerting on the delta, then treating every unexplained delta as either a change that should have gone through change management or a control that never held.
Alert design decides whether any of this works
A monitor that pages the team about eleven low-severity drifts a day gets muted within a fortnight, and muted monitoring is worse than none because it looks like coverage on a slide. Route by severity: block the deploy, open a ticket, or land on a weekly digest.
Track alert fatigue as a metric of the program. Rising volume with flat remediation means you are generating noise, and the honest response is to fix the thresholds, not to ask people to try harder.
Tasks
Answers are graded on the server: the answer key never reaches your browser.
Task 1: Ninety days of perfect
Scenario sim+90 XP
Name what the unbroken green run really indicates, then the definition the monitor is missing.
Incident brief
The change-approval monitor has reported PASS every day since February and is cited in the board pack as the strongest control in the program.
An engineer opens the query. It selects change requests whose status is not approved, joined to a table that a decommissioned ETL job stopped populating on 21 February. The join now returns zero rows for every window.
The monitor is also the only one in the estate that does not assert how many records it examined.
Term bank, not all of these are right
stale signalpopulationthresholddriftalert fatiguefalse negative
1.1Name what the ninety green days really indicate. (two words)
1.2Name the missing definition that would have exposed it. (one word)
Task 2: The bucket that was reopened for a weekend
Scenario sim+90 XP
Name the failure pattern, then the reference the monitor must compare against.
Incident brief
A public-access block is removed from a storage bucket at 02:10 on a Saturday during a data migration, with a ticket, an approver and a note saying it will be restored Monday.
It is not restored. The quarterly control test in April samples 25 buckets and does not select this one. The next test selects it in July and finds it compliant, because someone unrelated tightened it in June.
For four months the estate was in a state nobody intended and every test reported clean.
Term bank, not all of these are right
driftbaselinesamplingexceptionpopulationthreshold
2.1Name the failure pattern the four-month gap represents. (one word)
2.2Name the reference the monitor compares current state against. (one word)
Task 3: Muted in a fortnight
Scenario sim+80 XP
Name the condition the channel has developed, then the design change that fixes it.
Incident brief
CCM ships with 34 monitors, all paging a shared channel on any failure. Week one produces 1,900 notifications, most of them low-severity tagging drift on ephemeral test resources.
By week three the channel is muted. In week nine a monitor detects an over-privileged production role and pages correctly. Nobody reads it for eleven days.
The program dashboard still reports 34 of 34 monitors operating.
The monitoring platform raises findings continuously and the weekly report currently lists every open one, so nobody reads it.
Return the `id` of the findings that are genuinely past their remediation window: open, not covered by an active waiver, and older than the deadline for their own severity.
Table: findings
id   control_id       severity  age_days  state   waiver_active
101  IA-MFA-ADMIN     high      12        open    false
102  CM-CHANGE        low       40        open    false
103  EV-BACKUP        high      3         open    false
104  AC-LEAST         critical  2         open    false
105  IA-MFA-ADMIN     high      30        closed  false
106  EV-DRIFT         high      20        open    true

Remediation SLA: critical 1 day, high 7 days, low 90 days.
An active waiver suspends the clock until it expires.
Return one column: id.
Your continuous monitoring stack raised eight alerts overnight. The on-call GRC engineer has 30 minutes before standup.
Raise the alerts that indicate a real control failure. Leave the ones that indicate a monitoring artefact.
List only the lines that qualify, worst first. Severity is one of: critical | high | medium | low. Add or delete rows as needed.
Overnight alert queue
A-1  Monitor for admin MFA has not reported in 9 days; no alert was raised about its silence.
A-2  Threshold alert: privileged accounts rose from 12 to 47 in one hour.
A-3  Alert fired because the monitor's own credential expired; control state unknown since.
A-4  Alert: nightly backup job completed 20 minutes later than usual.
A-5  Drift detected: production security group opened 0.0.0.0/0 on port 22, still open.
A-6  Alert: same finding re-raised for the 340th consecutive night, ticket open, accepted risk documented.
A-7  Alert: monitor reports 0 resources in scope after a tag rename; reads as fully compliant.
A-8  Alert: CPU on the monitoring host at 78%.
1
2
3
4
5
6
7
8
9
10
11
12
Checks
The right findings are raised
Benign lines are left out
Severity matches the actual exposure
Ranked worst first
Next on your path · Data & Evidence
SQL for Compliance Data
Answer auditor questions with queries: coverage, exceptions, aging and control health metrics.